2018 NHL Draft
Draft Lottery Preview
Steve Kournianos | 04/27/2018 | Nashville | [hupso]
When: Saturday, April 28th, 2018
Where: Sportsnet Studios, Toronto, ON
Time: 7:30 p.m. EDT (Before San Jose-Vegas game)
Networks: Sportsnet, TVAS (Canada), NBC Sports Network (U.S.)
Teams: Buffalo, Arizona, Vancouver, Montreal, Chicago, Edmonton, Ottawa, Detroit, Dallas, NY Rangers, NY Islanders, Carolina, Florida, Philadelphia.
RULES
NASHVILLE (The Draft Analyst) — The NHL’s 2018 draft lottery, which will be broadcast around the world on Saturday, April 28th, is both simple and complicated at the same time. The 15 teams that fail to make the playoffs (or the team they traded their pick to) are assigned numeric odds based on how poorly they placed in the standings. The team with the worst record — in this year’s case, the Buffalo Sabres — has the best chance of winning the lottery, while the non-playoff team with the most points (AKA The Best Loser) has the lowest.
Back in the day, draft positioning was awarded NFL style — finish last, get the first pick. Finish second to last, get the second pick, and so on. Pretty straightforward, no? Plus it removed any doubt from the draft order, which every year is locked in on the last day of the regular season. The NHL and NBA, however, do things a tad differently, probably since both leagues under similar NFL-style systems had examples of teams doing everything in their power to lose and get the highest pick. It’s called “tanking”, and the NHL has gone to great lengths to keep garbage teams on the competitive up-and-up as their miserable seasons come to a close.
The draft lottery is a big deal, and the NHL treats it as such. Officials act pretty “Secret Squirrel” about this process in terms of avoiding any leaks or outside actors who could manipulate the process in their favor. The drawing itself is done in a secure area inside Sportsnet’s studios in Toronto. I mean, it’s not Fort Knox-secured, but for non-military operations, it’s an impregnable area nonetheless. To me, the room looks like a storage area in the building’s basement that they doll up and cater for presentation purposes. You figure all this league revenue would be enough to maybe spring for a fancier locale, but I digress. League commissioner Gary Bettman orchestrates the event for the dozen or so team representatives, a randomly-selected media member (yeah, right) and a camera crew records the event to hopefully dispell any accusation of wink-wink funny business. Off to the side are a handful of NHL lackeys in suit jackets who usually look way too uncomfortable to be involved in a such a high-stakes event. For whatever reason, the lackeys all look under 30 years old.
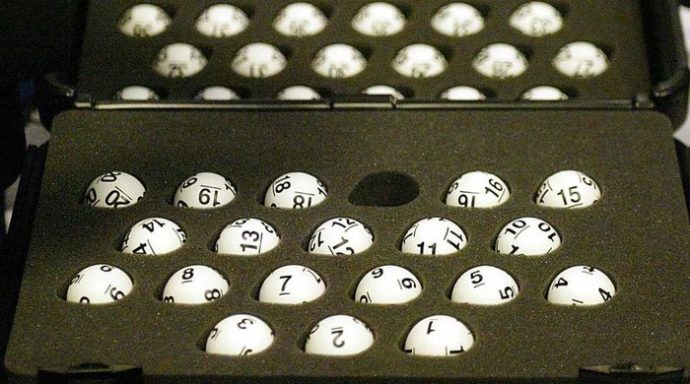
The league uses a mechanical air-blowing lotto machine that jumbles 15 numbered ping pong balls (1-15). These balls don’t have team logos on them. Just numbers between 1 and 15, and each ball dances and bounces inside the plastic air chamber, awaiting for a league “official” (I use that term loosely) to release each ball into the chamber to reveal the number. Do this four times, and you have yourself a drawing. Do three drawings, and there’s your NHL Draft lottery. The first drawing determines the owners of the first overall pick, the second and third identify the teams picking 2nd and 3rd overall.
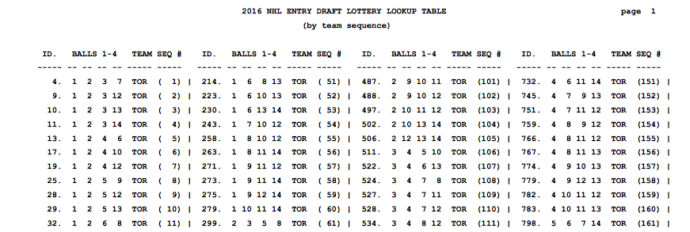
The league “official” draws each ball via a remote-controlled device that looks like the control unit on Darth Vader’s chest — three colored buttons, one which releases the numbered ping pong ball into the chamber. Each “drawing” is four presses of a button, with each press revealing a number. The order of the numbers after four presses — say, 2, 13, 4, 11 — is then scrubbed alongside a pre-determined list of team-assigned codes (see picture). The team that finished worse in the standings gets more code combinations, hence the draft lottery “odds”. For example, when the league says Buffalo has an 18.5% chance of winning the lottery, is just an easier way of saying the Sabres have 18.5% of the 1000 or so number combinations.
Now, the system seems ok, but the remote operator manically gazing at the bouncing balls as he releases them seems way too sketchy for my blood. I mean, how do we know this dude isn’t some eagle-eyed ex-CIA numbers prodigy with 20/10 vision who graduated Princeton and owns the Army record for longest sniper kill? Hopefully Commissioner Bettman tells the young lad to face away from the ping pong machine as he presses the button.
The 12 teams not selected in the 2018 Draft Lottery? That’s the easy part. Picks four through 15 will be based on NHL regular season standings. For example, if the team with the seventh slot (Blackhawks) wins the drawing for 2nd overall and the 10th team (Islanders) win the third pick, then the two teams that finished second and third-worst in the standings will drop to picking 4th and 5th overall, respectively. This is what happened last year when New Jersey (5th slot), Philadelphia (12th spot) and Dallas (8th slot) each won the lottery drawings to dump the three worst teams standings-wise — Colorado, Vancouver, Arizona and Vegas — out of the top three entirely.
ODDS
| DRAFT | RANK | TEAM | FINISH | 1OA ODDS | TOP-3 ODDS |
| 2018 | 1 | BUFFALO | 18.50% | 49.40% | |
| 2018 | 2 | OTTAWA | 13.50% | 38.80% | |
| 2018 | 3 | ARIZONA | 11.50% | 33.90% | |
| 2018 | 4 | MONTREAL | 9.50% | 28.80% | |
| 2018 | 5 | DETROIT | 8.50% | 26.10% | |
| 2018 | 6 | VANCOUVER | 7.50% | 23.30% | |
| 2018 | 7 | CHICAGO | 6.50% | 20.40% | |
| 2018 | 8 | NY RANGERS | 6.00% | 19.00% | |
| 2018 | 9 | EDMONTON | 5.00% | 16.00% | |
| 2018 | 10 | NY ISLANDERS | 3.50% | 11.40% | |
| 2018 | 11 | CAROLINA | 3.00% | 9.90% | |
| 2018 | 12 | NY ISLANDERS (CGY) | 2.50% | 8.20% | |
| 2018 | 13 | DALLAS | 2.00% | 6.60% | |
| 2018 | 14 | PHILADELPHIA (STL) | 1.50% | 5.00% | |
| 2018 | 15 | FLORIDA | 1.00% | 3.30% |
TOP PROSPECTS
| APR | JAN | SEP | NAME | POS | TM | LG |
| 1 | 1 | 1 | Andrei Svechnikov | RW | Barrie | OHL |
| 2 | 2 | 2 | Rasmus Dahlin | LHD | Frolunda | SHL |
| 3 | 3 | 3 | Filip Zadina | LW | Halifax | QMJHL |
| 4 | 6 | 8 | Adam Boqvist | RHD | Brynas J20 | Superelit |
| 5 | 4 | 5 | Joe Veleno | C | Drummondville | QMJHL |
| 6 | 8 | 6 | Brady Tkachuk | LW | Boston Univ. | HE |
| 7 | 12 | 22 | Oliver Wahlstrom | RW | U.S. U18 | NTDP |
| 8 | 5 | 4 | Ty Smith | LHD | Spokane | WHL |
| 9 | 7 | 18 | Joel Farabee | LW | U.S. U18 | NTDP |
| 10 | 10 | 10 | Quinn Hughes | LHD | Michigan | Big-10 |
| 11 | 11 | 15 | Rasmus Kupari | C | Karpat | SM-Liiga |
| 12 | 9 | 7 | Jesperi Kotkaniemi | LW/C | Assat | Liiga |
| 13 | 17 | 48 | Barrett Hayton | C | Sault Ste Marie | OHL |
| 14 | 16 | 33 | Noah Dobson | RHD | Acadie-Bathurst | QMJHL |
| 15 | 14 | 11 | Bode Wilde | RHD | U.S. U18 | NTDP |
| 16 | 13 | 17 | Akil Thomas | C | Niagara | OHL |
| 17 | 19 | 23 | Evan Bouchard | RHD | London | OHL |
| 18 | 20 | 28 | Vitali Kravtsov | RW | Chelyabinsk | KHL |
| 19 | 15 | 16 | Ryan McLeod | C | Mississauga | OHL |
| 20 | 30 | 31 | Jacob Olofsson | C | Timra IK | Allsvenskan |
| 21 | 55 | 77 | David Gustafsson | C | HV71 | SHL |
| 22 | 49 | 40 | Rasmus Sandin | LHD | Sault Ste Marie | OHL |
| 23 | 31 | 42 | Grigori Denisenko | LW | Loko Yaroslavl | MHL |
| 24 | 22 | 13 | Ty Dellandrea | C | Flint | OHL |
| 25 | 85 | NR | Ivan Morozov | C | Mamonty Yugry | MHL |
| 26 | 47 | 47 | Isac Lundestrom | C/LW | Lulea | SHL |
| 27 | 44 | 36 | Jesse Ylonen | RW | Espoo United | Mestis |
| 28 | 24 | 37 | K’andre Miller | LHD | U.S. U18 | NTDP |
| 29 | 28 | 46 | Dominik Bokk | RW | Vaxjo | SHL |
| 30 | 25 | 74 | Alexander Alexeeyev | LHD | Red Deer | WHL |
| 31 | 18 | 12 | Jared McIsaac | LHD | Halifax | QMJHL |
HISTORY
| DRAFT | TEAM | RANK | ODDS (1OA) | FINISH | +/- | PLAYER SELECTED |
|---|---|---|---|---|---|---|
| 2017 | COLORADO | 1 |
18.0%
|
4 | -3 | CALE MAKAR |
| 2017 | VANCOUVER | 2 |
12.1%
|
5 | -3 | ELIAS PETTERSSON |
| 2017 | VEGAS | 3 |
10.3%
|
6 | -3 | CODY GLASS |
| 2017 | NY RANGERS (ARI) | 4 |
10.3%
|
7 | -3 | LIAS ANDERSSON |
| 2017 | NEW JERSEY | 5 |
8.5%
|
1 | +4 | NICO HISCHIER |
| 2017 | BUFFALO | 6 |
7.6%
|
8 | -2 | CASEY MITTELSTADT |
| 2017 | DETROIT | 7 |
6.7%
|
9 | -2 | MIKE RASMUSSEN |
| 2017 | DALLAS | 8 |
5.8%
|
3 | +5 | MIRO HEISKANEN |
| 2017 | FLORIDA | 9 |
5.4%
|
10 | -1 | OWEN TIPPETT |
| 2017 | LOS ANGELES | 10 |
4.5%
|
11 | -1 | GABE VILARDI |
| 2017 | CAROLINA | 11 |
3.2%
|
12 | -1 | MARTIN NECAS |
| 2017 | VEGAS (WIN) | 12 |
2.7%
|
13 | -1 | NICK SUZUKI |
| 2017 | PHILADELPHIA | 13 |
2.2%
|
2 | +11 | NOLAN PATRICK |
| 2017 | TAMPA BAY | 14 |
1.8%
|
14 | E | CAL FOOTE |
| 2017 | VEGAS (NYI) | 15 |
0.9%
|
15 | E | ERIK BRANNSTROM |
| 2016 | TORONTO | 1 | 20.0% | 1 | E | AUSTON MATTHEWS |
| 2016 | EDMONTON | 2 | 13.5% | 4 | -2 | JESSE PULJUJARVI |
| 2016 | VANCOUVER | 3 | 11.5% | 5 | -2 | OLLI JUOLEVI |
| 2016 | COLUMBUS | 4 | 9.5% | 3 | +1 | PIERRE-LUC DUBOIS |
| 2016 | CALGARY | 5 | 8.5% | 6 | -1 | MATT TKACHUK |
| 2016 | WINNIPEG | 6 | 7.5% | 2 | +4 | PATRIK LAINE |
| 2016 | ARIZONA | 7 | 6.5% | 7 | E | CLAYTON KELLER |
| 2016 | BUFFALO | 8 | 6.0% | 8 | E | ALEX NYLANDER |
| 2016 | MONTREAL | 9 | 5.0% | 9 | E | MIKHAIL SERGACHEV |
| 2016 | COLORADO | 10 | 3.5% | 10 | E | TYSON JOST |
| 2016 | NEW JERSEY (OTT) | 11 | 3.0% | 12 | E | MIKE MCLEOD |
| 2016 | OTTAWA (NJ) | 12 | 2.5% | 11 | E | LOGAN BROWN |
| 2016 | CAROLINA | 13 | 2.0% | 13 | E | JAKE BEAN |
| 2016 | BOSTON | 14 | 1.0% | 14 | E | CHARLIE MCAVOY |
| 2015 | BUFFALO | 1 | 20.0% | 2 | -1 | JACK EICHEL |
| 2015 | ARIZONA | 2 | 13.5% | 3 | -1 | DYLAN STROME |
| 2015 | EDMONTON | 3 | 11.5% | 1 | +2 | CONNOR MCDAVID |
| 2015 | TORONTO | 4 | 9.5% | 4 | E | MITCH MARNER |
| 2015 | CAROLINA | 5 | 8.5% | 5 | E | NOAF HANIFIN |
| 2015 | NEW JERSEY | 6 | 7.5% | 6 | E | PAVEL ZACHA |
| 2015 | PHILADELPHIA | 7 | 6.5% | 7 | E | IVAN PROVOROV |
| 2015 | COLUMBUS | 8 | 6.0% | 8 | E | ZACH WERENSKI |
| 2015 | SAN JOSE | 9 | 5.0% | 9 | E | TIMO MEIER |
| 2015 | COLORADO | 10 | 3.5% | 10 | E | MIKKO RANTANEN |
| 2015 | FLORIDA | 11 | 3.0% | 11 | E | LAWSON CROUSE |
| 2015 | DALLAS | 12 | 2.5% | 12 | E | DENIS GURYANOV |
| 2015 | BOSTON (LAK) | 13 | 2.0% | 13 | E | JAKUB ZBORIL |
| 2015 | BOSTON | 14 | 1.0% | 14 | E | JAKE DEBRUSK |
| 2014 | BUFFALO | 1 | 25.0% | 2 | -1 | SAM REINHART |
| 2014 | FLORIDA | 2 | 18.8% | 1 | +1 | AARON EKBLAD |
| 2014 | EDMONTON | 3 | 14.2% | 3 | E | LEON DRAISAITL |
| 2014 | CALGARY | 4 | 10.7% | 4 | E | SAM BENNETT |
| 2014 | NY ISLANDERS | 5 | 8.1% | 5 | E | MICHAEL DAL COLLE |
| 2014 | VANCOUVER | 6 | 6.2% | 6 | E | JAKE VIRTANEN |
| 2014 | CAROLINA | 7 | 4.7% | 7 | E | HAYDN FLEURY |
| 2014 | TORONTO | 8 | 3.6% | 8 | E | WILLIAM NYLANDER |
| 2014 | WINNIPEG | 9 | 2.7% | 9 | E | NIKOLAJ EHLERS |
| 2014 | ANAHEIM (OTT) | 10 | 2.1% | 10 | E | NICK RITCHIE |
| 2014 | NEW JERSEY | 11 | 1.5% | FORFEIT | N/A | NO PICK |
| 2014 | NASHVILLE | 12 | 1.1% | 11 | E | KEVIN FIALA |
| 2014 | ARIZONA | 13 | 0.8% | 12 | E | BRENDAN PERLINI |
| 2014 | WASHINGTON | 14 | 0.5% | 13 | E | JAKUB VRANA |
| 2013 | FLORIDA | 1 | 25.0% | 2 | -1 | ALEKSANDER BARKOV |
| 2013 | COLORADO | 2 | 18.8% | 1 | +1 | NATHAN MACKINNON |
| 2013 | TAMPA BAY | 3 | 14.2% | 3 | E | JONATHAN DROUIN |
| 2013 | NASHVILLE | 4 | 10.7% | 4 | E | SETH JONES |
| 2013 | CAROLINA | 5 | 8.1% | 5 | E | ELIAS LINDHOLM |
| 2013 | CALGARY | 6 | 6.2% | 6 | E | SEAN MONAHAN |
| 2013 | EDMONTON | 7 | 4.7% | 7 | E | DARNELL NURSE |
| 2013 | BUFFALO | 8 | 3.6% | 8 | E | RASMUS RISTOLAINEN |
| 2013 | VANCOUVER (NJ) | 9 | 2.7% | 9 | E | BO HORVAT |
| 2013 | DALLAS | 10 | 2.1% | 10 | E | VALERI NICHUSKIN |
| 2013 | PHILADELPHIA | 11 | 1.5% | 11 | E | SAMUEL MORIN |
| 2013 | ARIZONA | 12 | 1.1% | 12 | E | MAX DOMI |
| 2013 | WINNIPEG | 13 | 0.8% | 13 | E | JOSH MORRISSEY |
| 2013 | COLUMBUS | 14 | 0.5% | 14 | E | ALEX WENNBERG |


